Debugging .NET code called from Java
Both for .NET and Java, one of the most important features provided by an IDE is the ability to track code execution at runtime. Either when looking for bugs in the dynamic portion of code or verifying correctness of a complex algorithm - debugging brings unquestionable improvement into development process.
In case of the Javonet users dealing with the debugging task, its importance doubles as relating to both supported domains: .NET and Java. Let's see how easily this can be achieved and applied against any managed assembly.
Workspace
For the purpose of this example, I'll be using the following .NET class representing a simple Person entity, having two properties Firstname and Lastname, and being able to return a DisplayName, being a trivial concatenation of the former:
namespace TestNamespace
{
	public class Person
	{
		public string Firstname { get; set; }
		public string Lastname { get; set; }

		public string DisplayName()
		{
			return Firstname + " " + Lastname;
		}

	}
}
The Java code that will interoperate with our Person class is as follows:
package main;

import com.javonet.Javonet;
import com.javonet.JavonetException;
import com.javonet.JavonetFramework;
import com.javonet.api.NObject;

import static utils.ActivationCredentials.yourEmail;
import static utils.ActivationCredentials.yourLicenseKey;
import static utils.Constants.resourcesDirectory;

public class Main {
    public static void main(String[] args) throws JavonetException {
        // activates Javonet framework using provided credentials and JavonetFramework argument,
        // successful execution of this step loads CLR within Java process,
        // allowing our .NET debugger to be attached
        Javonet.activate(yourEmail, yourLicenseKey, JavonetFramework.v45);

        // instructs Javonet to load classes referenced in the DLL library file
        // under given path into the CLR, which makes our Person class accessible
        Javonet.addReference(resourcesDirectory + "\\TestClass.dll");

        // instantiate a new Person class object and set its properties to relevant values
        NObject person = Javonet.New("Person");
        person.set("Firstname", "Frodo");
        person.set("Lastname", "Baggins");

        // invokes Person object’s DisplayName method and
        // stores its return value in local String variable
        String displayName = person.invoke("DisplayName");

        // prints resultant DisplayName value from .NET code
        // to standard output of Java process
        System.out.println(displayName);
    }
}
Debugging Procedure
Since debugging happens at runtime, we'll start by launching our Java code. As already mentioned, it's important to activate Javonet before attempting to place any breakpoint on Java side of our solution, as this
will start CLR within our process. Let's put a breakpoint right after the activate method, as presented below.

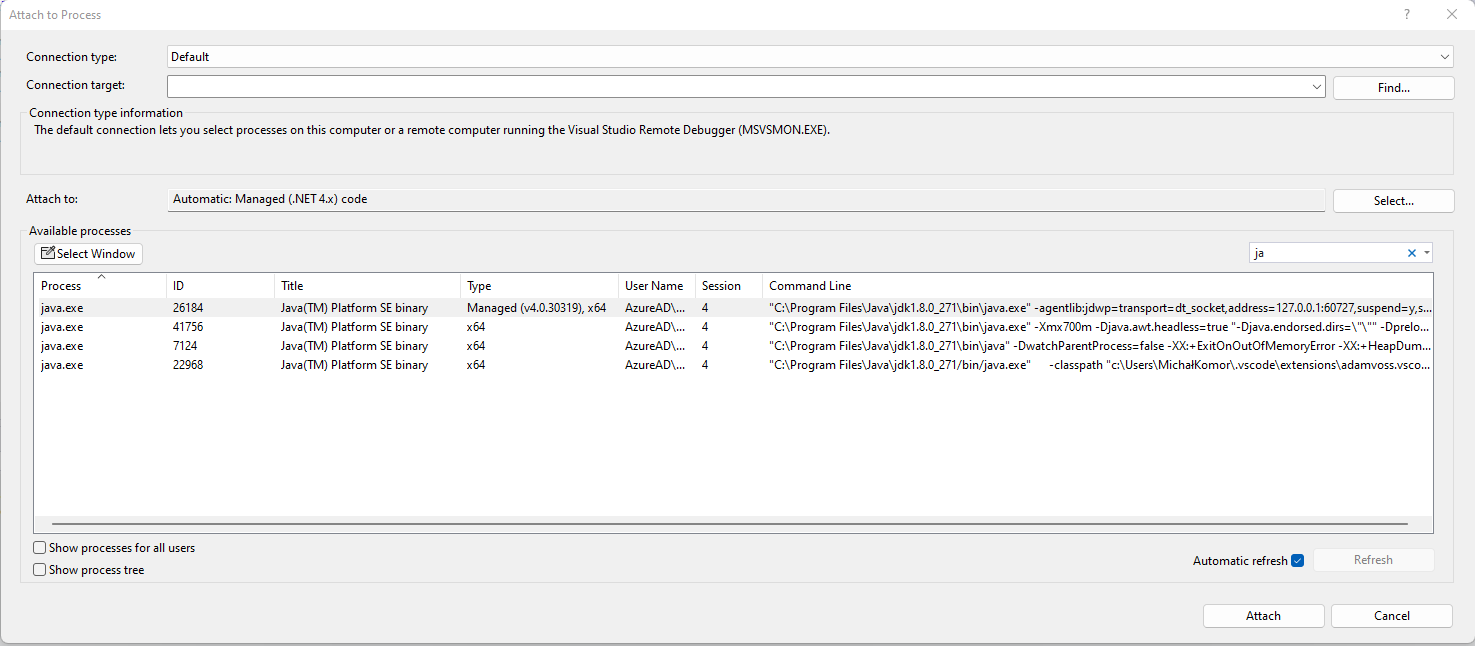
Now let's switch to our Visual Studio and attach a debugger to the newly started Java process with CLR. In order to do that, go to Debug > Attach to Process, and select appropriate java.exe or javaw.exe process. Notice that its Type value should indicate that it's hosting managed code using .NET version matching the one we've specified in Javonet activate method using JavonetFramework argument.
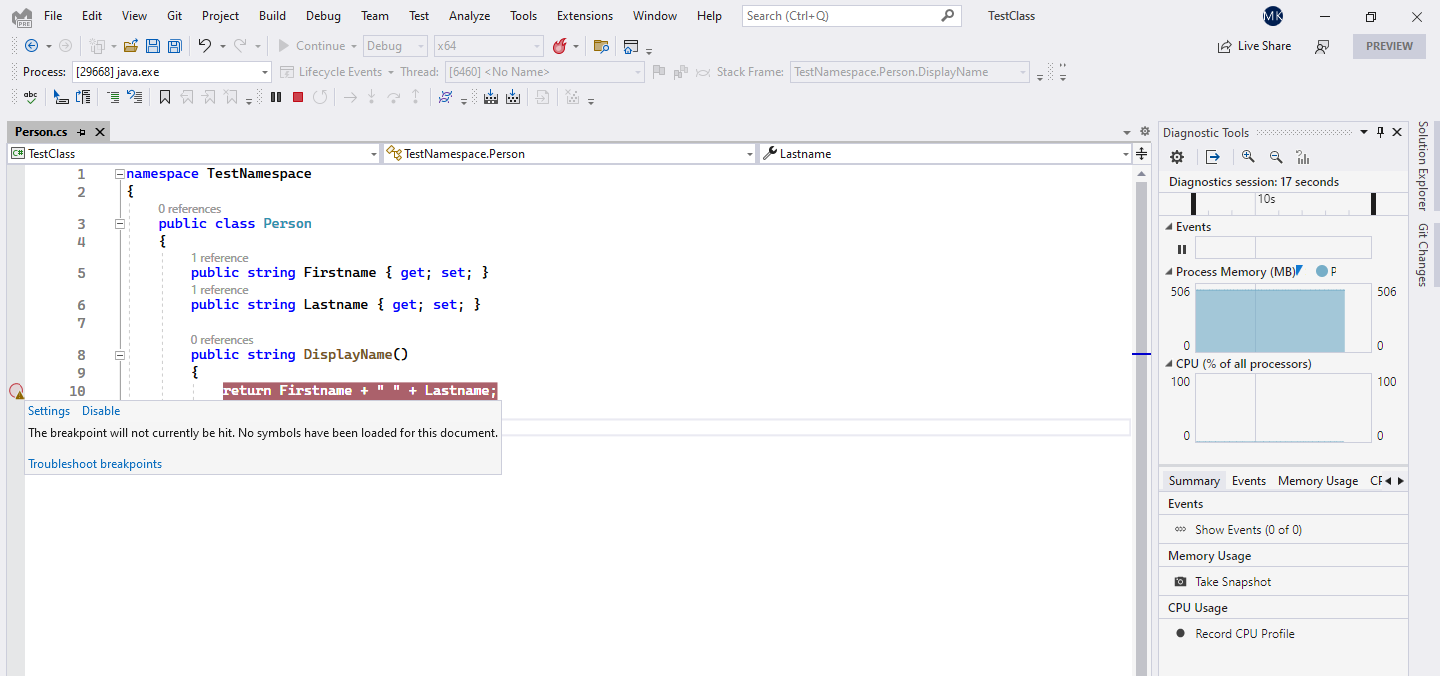
We're almost ready to start debugging. Let's put a breakpoint in the body of Person's class DisplayName method. Notice that the breakpoint circle symbol is hollow inside, since the debugging symbols have not been loaded into CLR yet.
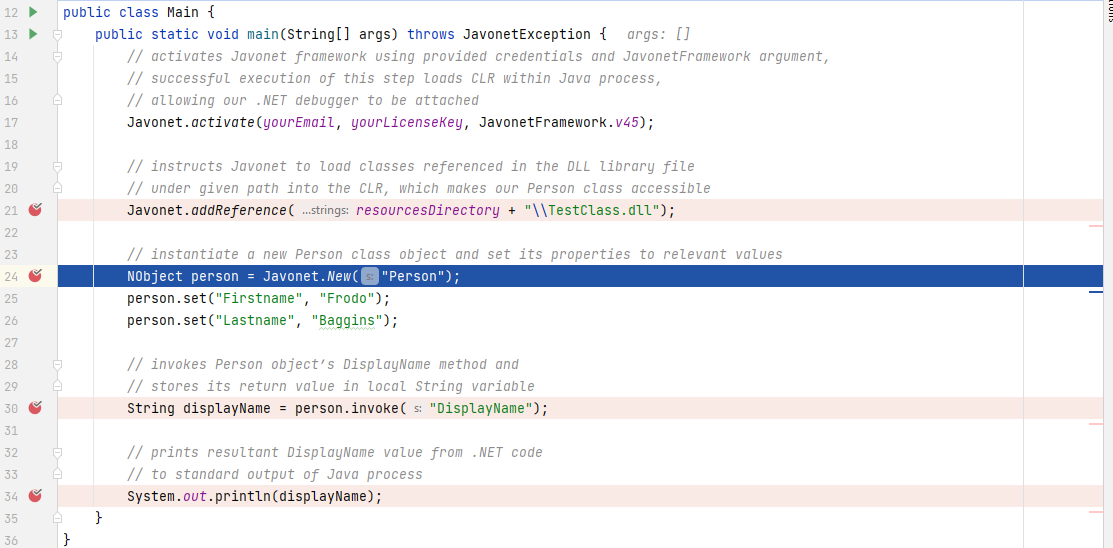
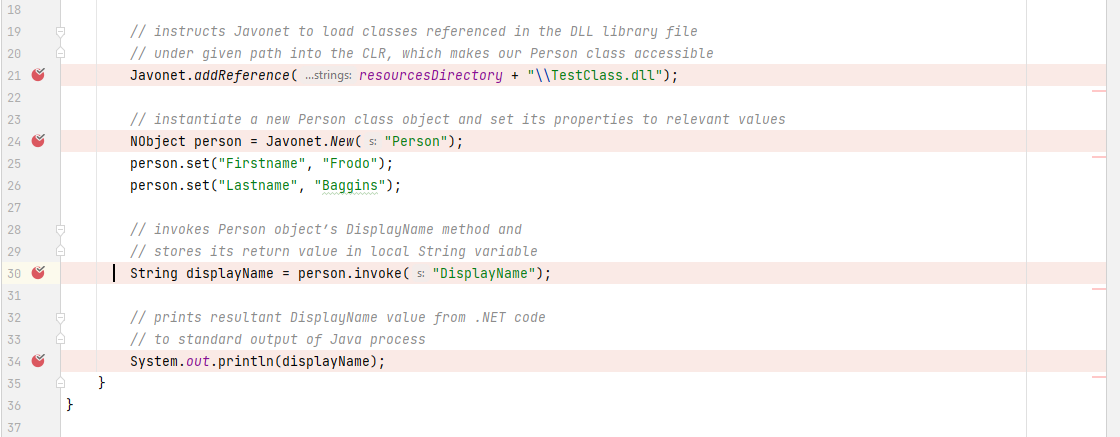
On Java side, let's move one step forward by putting a breakpoint on line with NObject person...
Calling addReference method loads our DLL library which should result in Person class becoming available for debugging in Visual Studio.
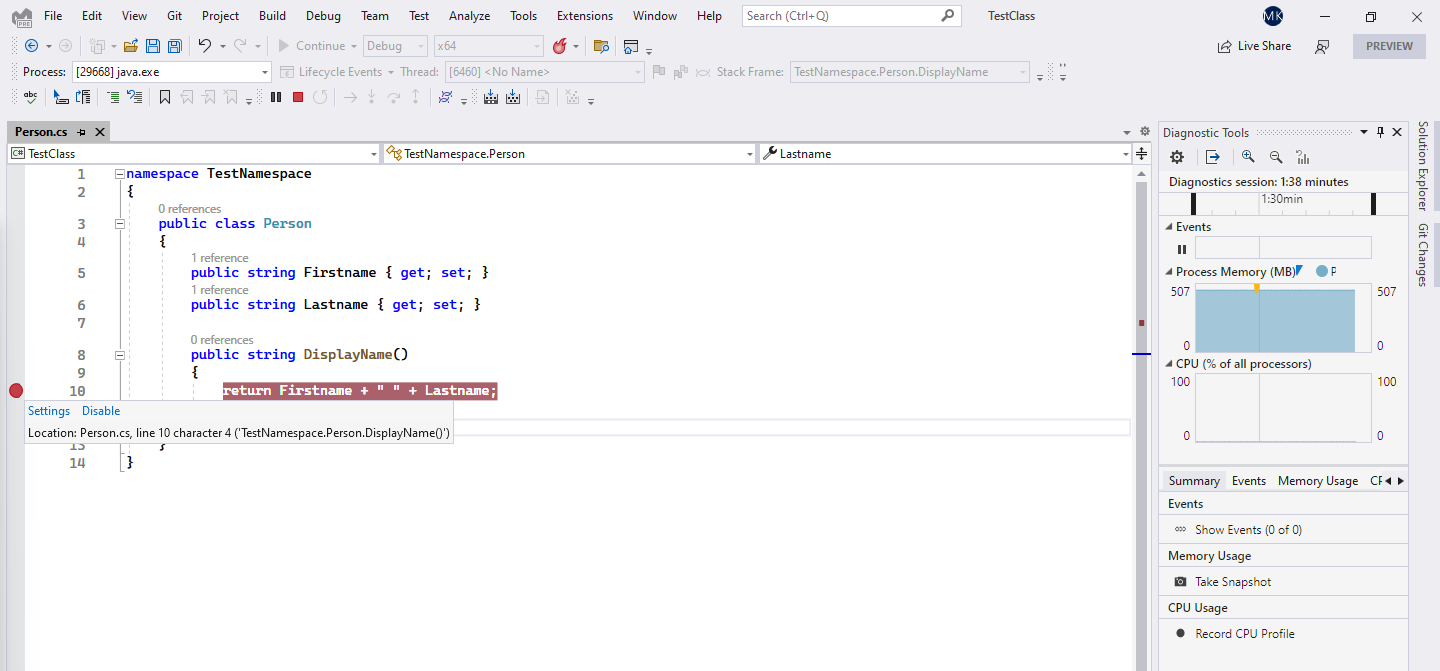
As you can see, the circle symbol is now completely filled. At this point our breakpoint will get hit once the DisplayName method is invoked on Java side.
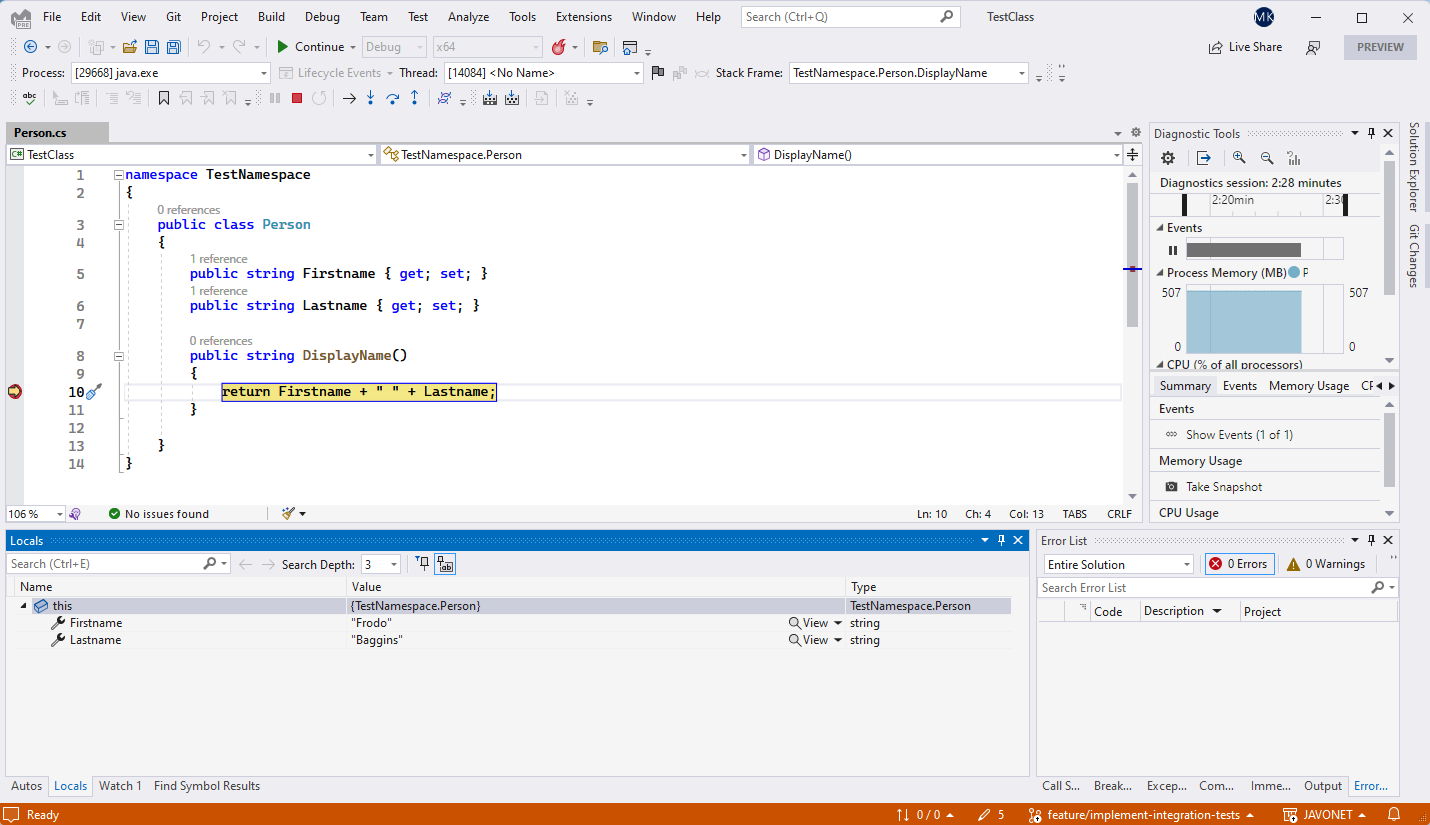
In Java IDE, let's proceed with code execution until line with String displayName is reached. Passing this point will result in hitting breakpoint in Visual Studio.
As you can see, we can now use .NET debugger for all our intended activities, like variables' inspection, runtime values modification etc.
Once our work with debugging Person class is done and normal code execution is resumed in Visual Studio debugger, it'll be transferred back to Java.
 Next, we'll get a returned display name value of our Person object instance.
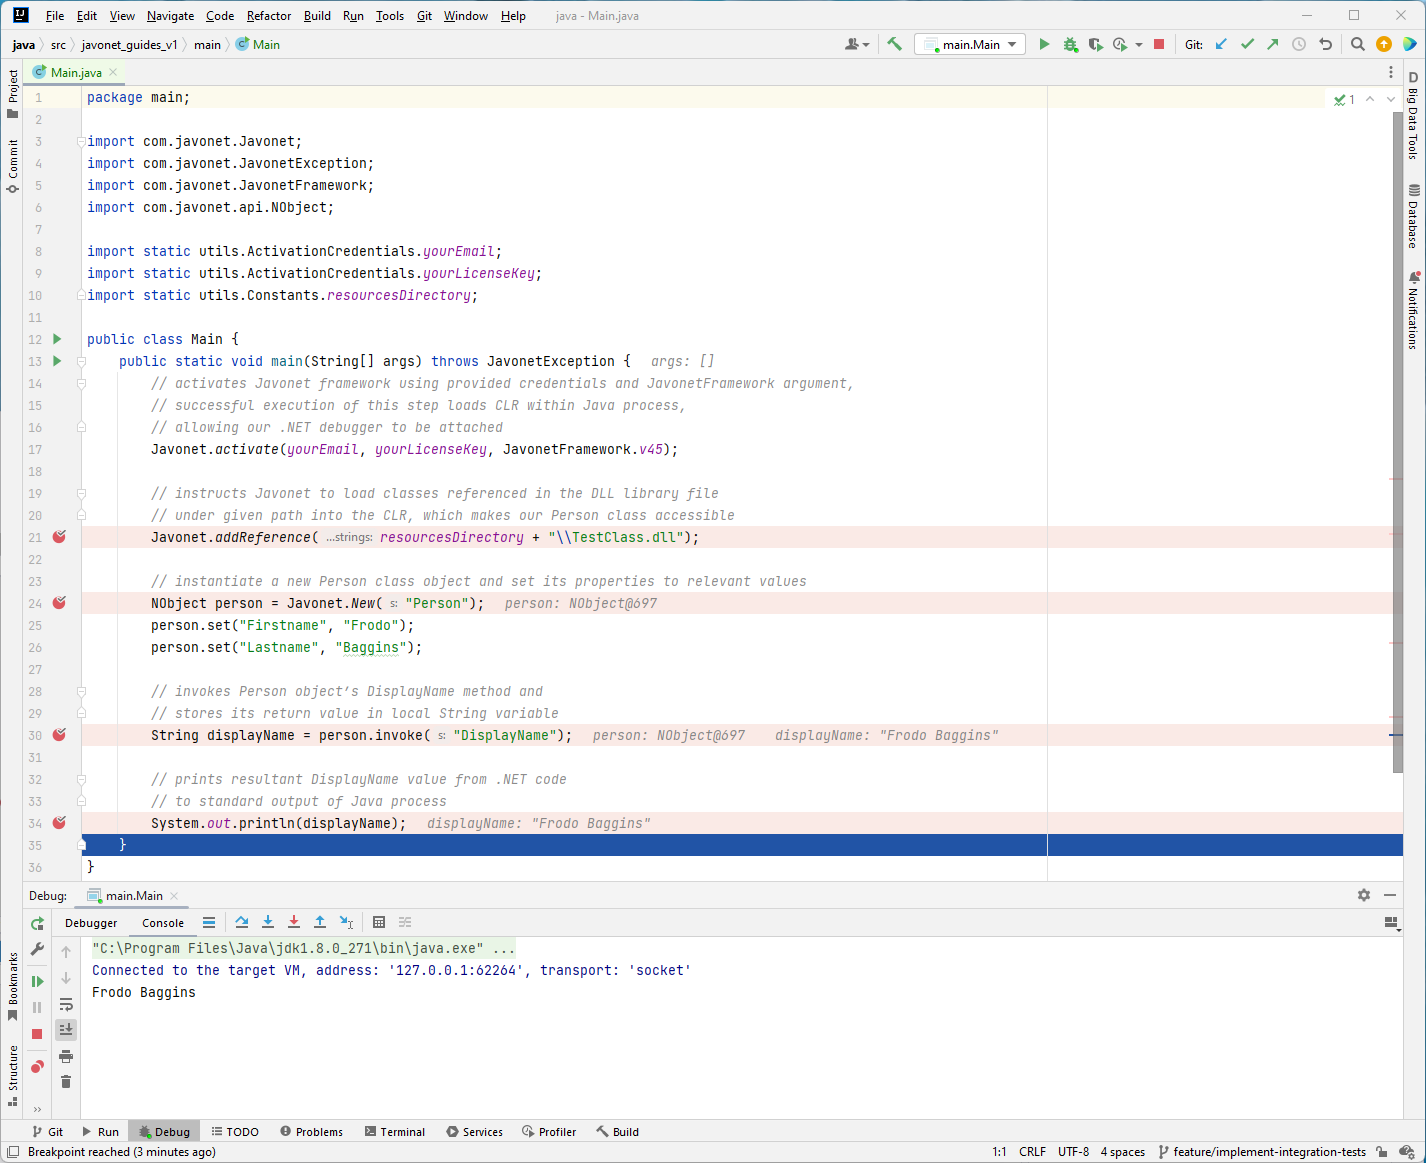 As the program finishes, both debuggers will stop execution.
Debugging Without .NET Source Project
Presented debugging method is available also in situations when we do not have access to library source code, provided that the related debugging symbols .pdb file for analysed program or library is available on the Javonet classpath at runtime. We would also need to know full namespace, class name and target method, where to put a breakpoint.
Rerun Java code from Java IDE, breaking its execution at line with Javonet.addReference... to launch a new Java CLR-enabled process. In Visual Studio make sure you've closed solution for our previous example. As done before, attach debugger to respective managed java.exe or javaw.exe process.
Our next step would be to insert new breakpoint. As we do not have the source code available, we'll need to specify its location manually. In order to do that we can go either to the breakpoint window New > Break at function, go to Debug > New Breakpoint > Break at function or use the Ctrl + B shortcut. Any of these paths will result in opening new window where we're asked to put the location of our breakpoint by specifying fully qualified method name.
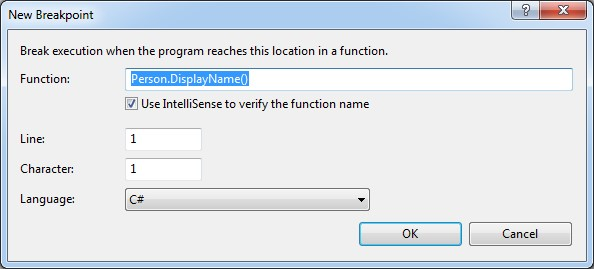
Once we are happy with our input, Visual Studio might notify us about not being able to find the specified location, which is understandable due to lack of source code. After accepting this notification we should be presented with a breakpoint entry similar to the one in the following picture. The circle will be hollow again, since we've not loaded our .NET library via Javonet API yet.

If we proceed with Java code execution, the breakpoint symbol will again get filled, similarly to how it behaved in previous example. Also, the breakpoint location now contains fully qualified signature of the targeted method.

At this point, we are ready to debug our .NET application, therefore let's proceed with Java code execution. Running line with String displayName = ... will hit our specified breakpoint, returning control to Visual Studio, where we'll be presented with a source code generated based on the supplied debugging symbols file.

Summary
In this article we've learnt how to properly attach Visual Studio debugger to Java process hosting CLR managed code run by Javonet. The approach has been presented for two scenarios, distinguished by the availability of source code, proving easy access to all of the features offered by Visual Studio debugger that can be used during development of Java application using .NET libraries, drivers or SDKs with Javonet.
Was this article helpful?